
Master Pinterest Analytics: Boost Your Strategy Today
19 June 2025
Finding Your Analytics Dashboard: Where Your Data Lives
Before you can figure out what your audience truly loves, you first need to find the story hidden within your data. Your Pinterest Analytics dashboard is the command center for this, but getting to the good stuff requires one essential element: a Pinterest Business account. If you’re still using a personal profile, making the switch should be your top priority. It's free and opens up the detailed insights you need to build a real strategy. A personal account only scratches the surface, but a business account gives you the detailed data we're about to explore.
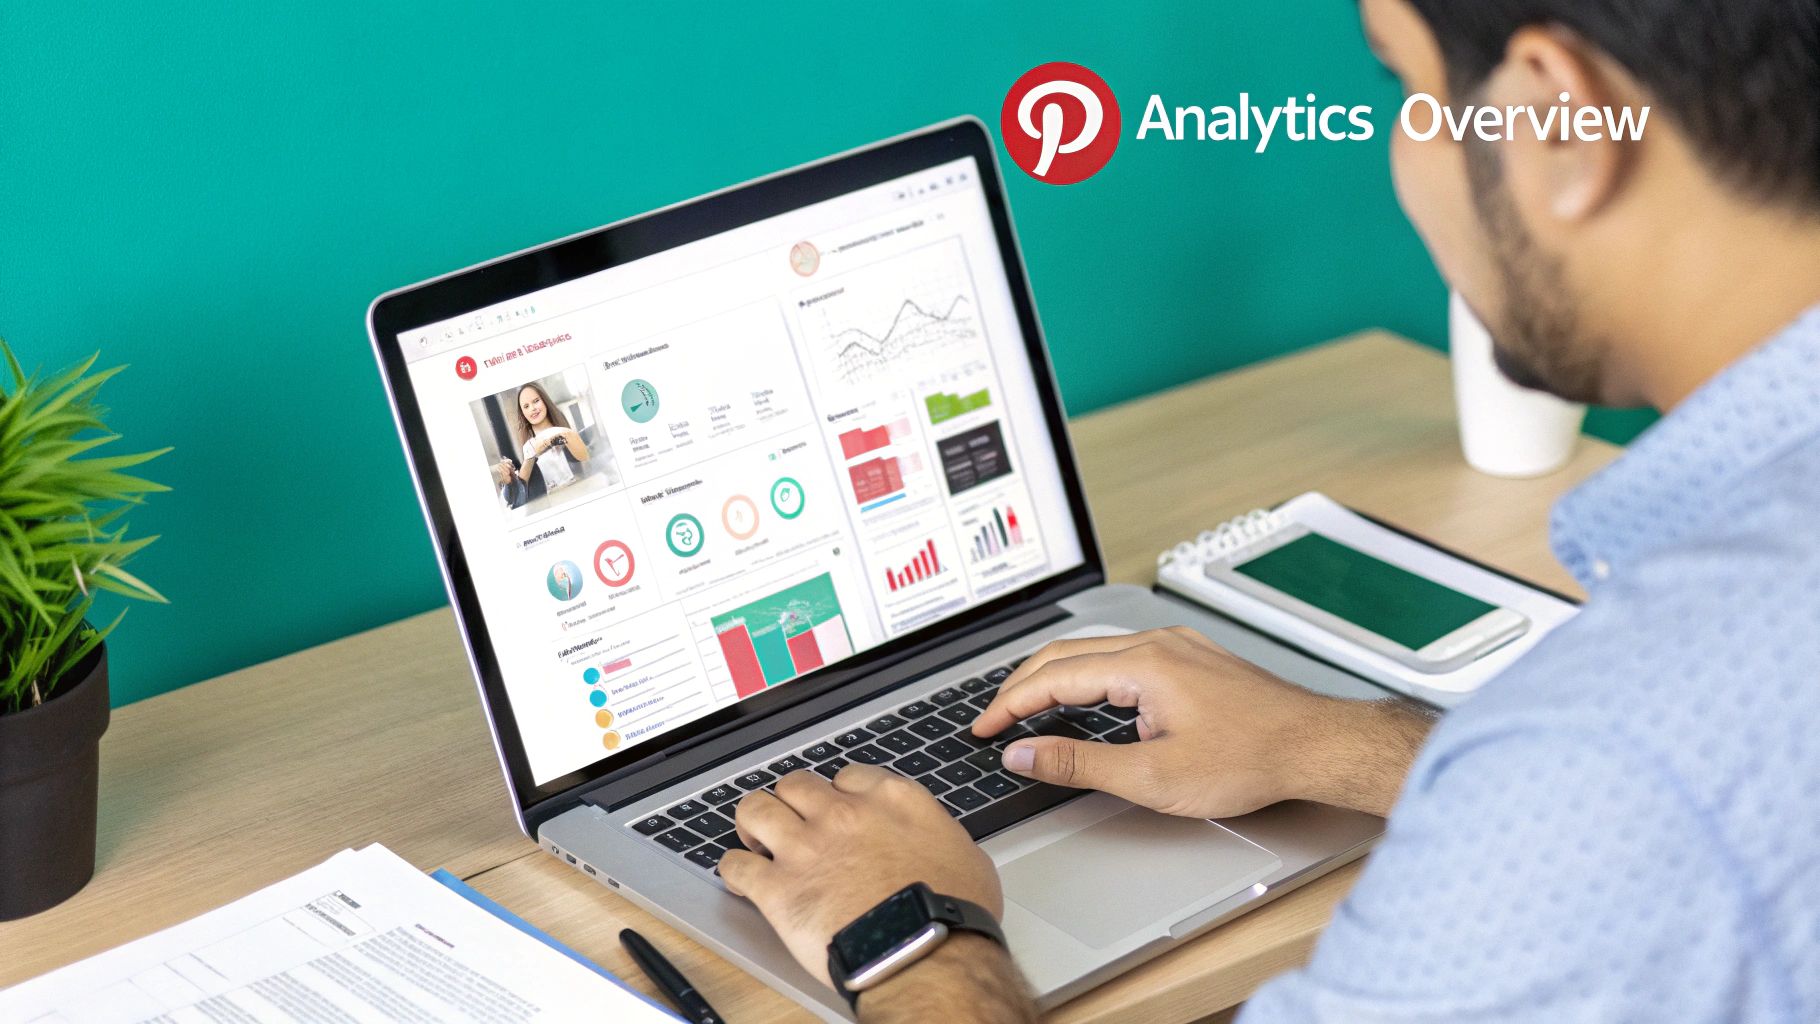
Once your business account is ready, finding your analytics is simple. From a desktop, just glance at the top-left corner of your profile page. You’ll spot a tab labeled “Analytics.” Clicking this opens a dropdown menu, and "Overview" is your main destination. Think of the Overview page as your account's report card, showing you the big picture of your performance—from impressions to audience growth—over a specific time.
Navigating the Key Analytics Sections
This dashboard is more than just one page; it's a collection of useful reports. The main areas you'll spend time in are:
- Overview: This is your home base for a quick health check. It gives you a snapshot of your most important metrics, letting you see performance trends, your best-performing Top Pins, and which of your boards are driving the most engagement (Top Boards).
- Audience Insights: Here’s where you truly get to know the people interacting with your content. It goes way beyond a simple follower count, showing you demographics like age, gender, location, and the devices they use. Even better, it reveals their top interests—a goldmine for brainstorming future content ideas.
- Trends: This is a fantastic tool for content planning. The Trends section shows you what's currently popular on Pinterest. You can find rising search terms in your niche, which helps you create content that people are actively looking for.
This combination of data is precisely why so many creators are drawn to the platform. The potential for reach is huge and still growing. In the first quarter of 2025, Pinterest reported a new milestone of 570 million monthly active users globally, marking a 10% increase from the previous year. This growth cements its role as a major player, especially with its ads reaching over 340 million users in January 2025 alone. You can always delve into more Pinterest statistics to see the full picture.
Setting Up for Success
To get the most accurate information, especially for website traffic and conversions, a couple of setup steps are crucial. First, claiming your website is a must-do. This process links your site to your Pinterest profile, which adds your profile picture to any Pin saved from your domain and gives you analytics for that content. It’s a badge of authenticity that builds trust and unlocks key data.
You also need to use strong keywords in your Pin titles and descriptions. This directly affects how easily your content gets discovered through Pinterest search, which acts like a visual search engine. For a deep dive on this topic, our guide on how to perform Pinterest keyword research has you covered. By knowing where to find your data and making sure your account is set up correctly, you’re ready to turn numbers into a powerful part of your strategy.
Reading Your Numbers: What Each Metric Actually Tells You
Jumping into your Pinterest analytics can feel a bit overwhelming at first. You're met with graphs and a bunch of numbers, and it’s not always clear what they mean. But think of these metrics as the story of your content. They tell you exactly how people are finding and interacting with your pins, helping you move past just counting views to understanding what truly works.
Not all attention on Pinterest is the same. A pin with 5,000 Impressions looks great on the surface, but it's only the first chapter of the story. Impressions simply count how many times your pin appeared in someone's feed or search results. It’s a measure of visibility. High impressions are a good sign that your keywords and timing are on point, but it doesn't tell you if your content actually stopped someone's scroll.
That's where engagement metrics come in, adding the real substance to your content's story.
The Story Behind the Engagement
Engagement is more than just a single click; it’s a measure of genuine interest. Metrics like Closeups and Saves tell you a much richer story than impressions alone. A Closeup happens when someone taps on your pin to get a better look. A high number of closeups means your visuals and titles are doing their job—they're grabbing attention and making people curious.
A Save is an even bigger deal. When a user saves your pin to one of their boards, they're bookmarking it for later. This is a powerful signal that your content is valuable, inspiring, or useful. More saves mean your pin is seen as high-quality, which helps Pinterest show it to more people over a longer period.
The metric most businesses are chasing is the Outbound Click. This is when a user clicks through your pin to your website, blog post, or product page. This is your direct link to driving traffic and sales. A pin with fewer impressions but a high outbound click rate is a goldmine—it means you're attracting a motivated audience ready to take the next step. This is the magic of Pinterest; research shows that 85% of weekly Pinners have purchased something based on pins from brands. You can explore more powerful Pinterest statistics that really highlight its impact on buying decisions.
Comparing Metrics for Deeper Insights
The key to truly understanding performance is to stop looking at metrics in isolation. The real insights appear when you start comparing them. For example, if a pin gets a ton of impressions but almost no saves or clicks, it might mean your keywords are too broad and aren't attracting the right audience.
To help you connect the dots, here’s a breakdown of what each key metric is telling you and how you can use that information.
Pinterest Analytics Metrics Breakdown
A comprehensive comparison of key Pinterest metrics and what they indicate about your content performance.
| Metric | What It Measures | Why It Matters | Optimization Focus |
|---|---|---|---|
| Impressions | The total number of times your pins were displayed. | Indicates your reach and how well your keywords are performing in search and feeds. | Keyword optimization and pinning at peak times to maximize visibility. |
| Saves | The number of times users saved your pin to their boards. | Shows your content is valuable and has long-term appeal. Boosts pin lifespan. | Creating high-quality, "evergreen" content that users want to reference later. |
| Outbound Clicks | The number of clicks from your pin to an external URL. | Measures how effectively your pin drives traffic to your website or blog. | Crafting compelling call-to-actions (CTAs) and ensuring the pin promises what the link delivers. |
| Engagements | A combination of saves, outbound clicks, and closeups. | Provides a well-rounded view of how interactive and compelling your pin is. | A balance of great visuals, strong CTAs, and valuable content. |
By looking at these numbers together, you can shift from just counting views to truly understanding your influence on the platform. This data-driven approach gives you a clear path to creating content that doesn't just get seen but inspires real action.
Identifying Your Winning Pins: What Success Actually Looks Like
It's a thrill when a pin takes off, pulling in thousands of impressions in just a few hours. But while that rush is nice, real success on Pinterest is about more than a fleeting moment of fame. The pins that truly matter are the ones that consistently work for you over the long haul, driving results that actually help your business—whether that’s more website traffic, new email subscribers, or sales. Learning to spot these powerhouse pins will completely change your strategy.
A pin with tons of impressions but hardly any engagement is like a flashy billboard on the side of the road. People see it, but they just keep driving. To find your true champions, you have to look at how different metrics work together in your Pinterest analytics. The most valuable pins usually have a solid balance of saves and outbound clicks. This shows that people not only think your content is worth keeping but are also motivated enough to click through and see more.
Digging Deeper Than Surface Metrics
Let's say you run a food blog and you’ve just shared a new recipe for "Easy Weeknight Pasta." You create two different pins for it.
- Pin A: A stunning, simple photo of the finished pasta dish. It gets 10,000 impressions and 200 saves, but only 15 outbound clicks.
- Pin B: A quick video showing a time-lapse of you making the recipe. It gets 4,000 impressions and 75 saves, but it sends 150 outbound clicks to your blog.
At a quick glance, Pin A seems like the star because of its high impressions and saves. But if your goal is to get people to your blog, Pin B is the clear winner. It did a much better job of turning casual viewers into actual website visitors. This difference is everything; it’s what separates building brand awareness from actually building your business. Getting comfortable with how to analyze content performance in general will help you understand what makes a pin truly successful.
You can see this in action in your "Top Pins" dashboard, where you can sort by different metrics to uncover these kinds of insights.
This view lets you instantly compare pins based on the metrics that matter most to your goals, helping you spot patterns in what works best for your audience.
The Anatomy of an Evergreen Performer
Your top-performing content usually fits into one of two buckets: trending or evergreen. Trending pins jump on a specific moment, like a holiday, a seasonal spike in searches, or a hot topic. They give you a quick blast of traffic but tend to fizzle out just as quickly.
On the other hand, evergreen pins are the long-term workhorses of your Pinterest account. They solve a core problem or speak to a lasting desire of your audience, staying relevant for months or even years. While content on most social platforms has a short shelf life, Pinterest's search-driven nature means your pins can keep getting views and clicks long after they're published.
To find your evergreen winners, you need to look at your pin performance over longer periods, like 90 days or more. Search for pins that bring in a steady, consistent flow of impressions and clicks without any extra promotion. These are the topics your audience is always looking for. Once you’ve identified them, your job is to create more content around those proven themes. Try different designs, new angles, and keyword variations to build out a library of content that works for you 24/7. This focused strategy, informed by your analytics, transforms your profile from a simple content feed into a reliable traffic-driving machine.
Learning From Pins That Flopped: Why Some Content Falls Flat
It’s natural to want to celebrate your successful pins, but your biggest lessons often come from the content that doesn't perform well. Digging into a pin that flopped isn't about getting discouraged; it's a chance to uncover hidden clues that will make your future content even better. Not every pin that underperforms fails for the same reason, and by looking at the data, you can diagnose the issue and turn a disappointment into a roadmap for what to do next.
Sometimes, a pin just misses the mark because of bad timing or an image that doesn't grab attention. Other times, the problem is deeper—a disconnect between what you're posting and what your audience actually wants to see. A great starting point is your audience demographics. If you're creating content for busy parents, but your analytics show your main audience is college students, you've found a clear mismatch.
Pinpointing the Problem: Content vs. Optimization
When a pin doesn't do well, the cause usually falls into one of two buckets: a content problem or an optimization problem. A content problem means the core idea just didn't connect. Maybe the topic wasn't interesting enough, the design was confusing, or the value wasn't clear. An optimization problem, on the other hand, means you had a good idea, but it wasn't set up for success on Pinterest. This could be anything from weak keywords to a vague description or a missing call-to-action.
So how do you tell the difference? Look at the metrics in combination. A pin with very low impressions probably has an optimization issue. Pinterest’s algorithm couldn't figure out who to show it to because the keywords were off. But a pin with decent impressions but almost no saves or outbound clicks likely has a content issue. People saw it, but it wasn't compelling enough to make them act. Using a tool like Pin Generator can help you see these patterns by comparing the performance of many pins at once.
This infographic shows a typical audience profile, highlighting how factors like age, gender, and location can shape what content performs well.
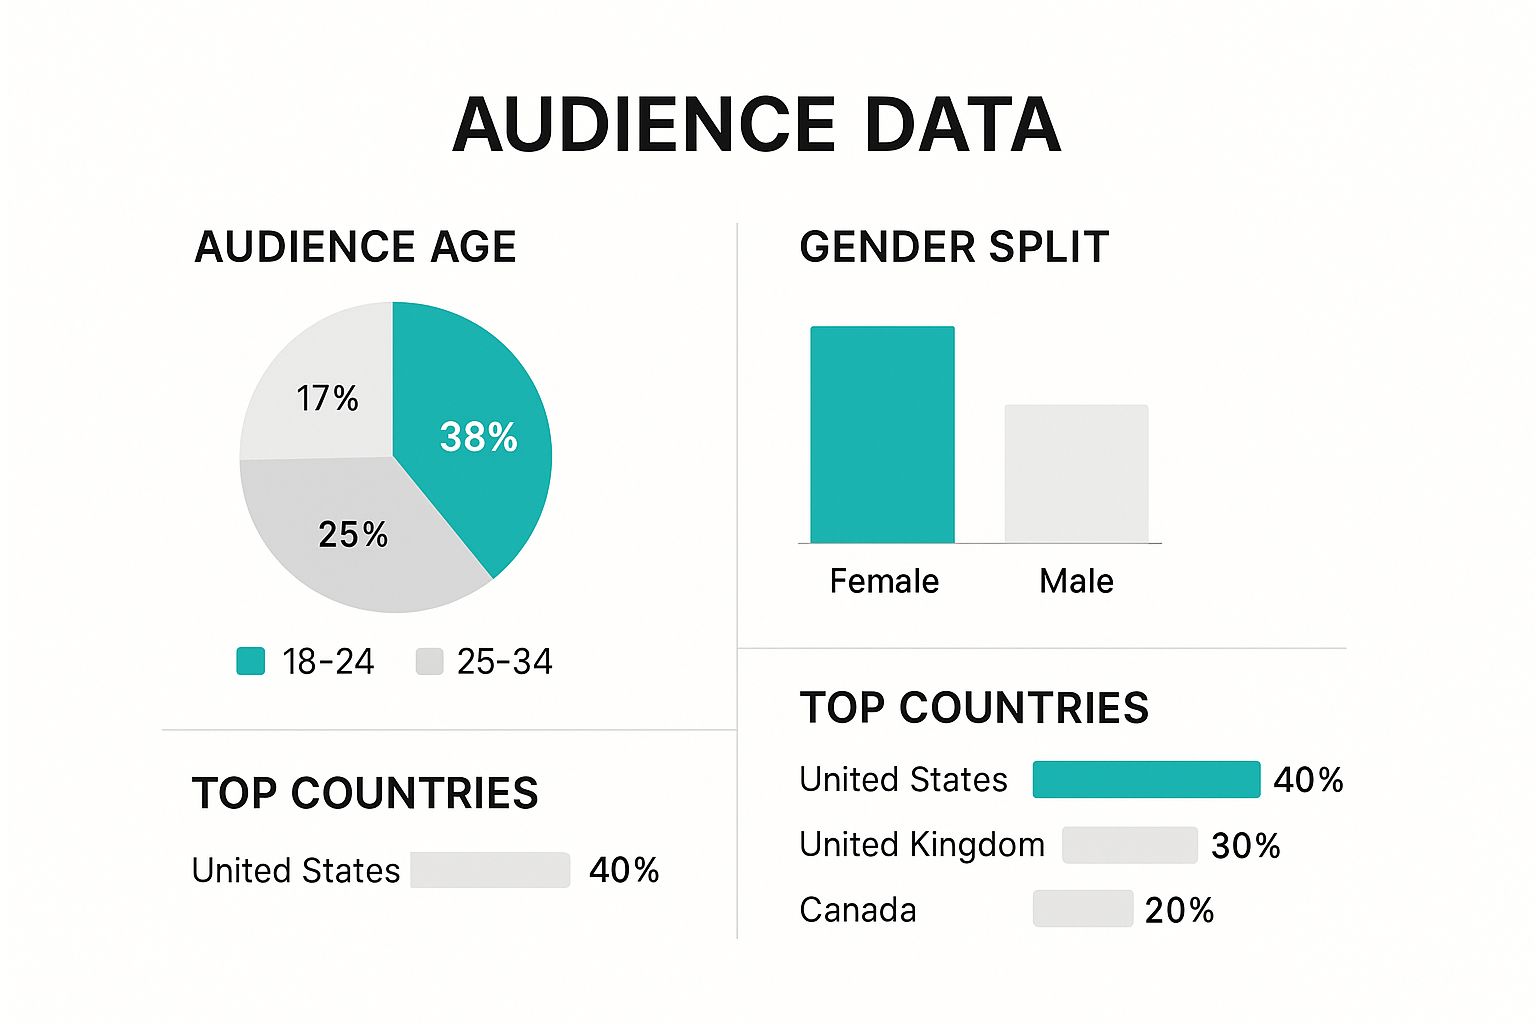
Knowing who you're talking to helps you avoid creating content that's aimed at the wrong people from the start.
A Framework for Troubleshooting Underperforming Pins
Instead of just archiving a pin that didn't work, treat it as a learning moment. Sometimes, the best way to understand why something failed is to break down the potential causes and solutions. I find it helpful to use a simple framework to diagnose what went wrong.
To help you get started, here’s a table outlining common issues, their likely causes, and how you can fix them.
Common Pin Performance Issues and Solutions
Analysis of frequent reasons why pins underperform and practical fixes for each issue
| Performance Issue | Likely Causes | Quick Fixes | Prevention Strategy |
|---|---|---|---|
| Low Impressions | Weak or irrelevant keywords; Pinned at a low-traffic time; Not a trending topic. | Archive the pin and republish with stronger, researched keywords at a better time. | Use keyword research tools and schedule pins during your audience's peak activity hours. |
| High Impressions, Low Clicks | Unclear call-to-action (CTA); Pin design is unappealing or busy; Headline isn't compelling. | Create a new pin for the same link with a clearer CTA, a fresh design, and a stronger headline. | A/B test different pin designs and CTA phrases to find what your audience responds to. |
| High Clicks, Low Saves | The content is useful for a moment but isn't "evergreen"; The topic is timely or news-related. | This isn't always a problem! It just means the pin served an immediate need. | Balance your strategy by creating more evergreen content that solves a recurring problem for your audience. |
| No Engagement at All | Mismatch between the pin's visual/topic and your audience's core interests. | Review your Audience Insights to check their top categories and recent interests. | Regularly check your audience analytics to ensure your content strategy is still aligned with what they want. |
By systematically looking at what isn’t working, you build a much deeper understanding of what does. Every failed pin contains a valuable piece of data. Your job is to listen to what that data is telling you and adjust your approach, giving your next batch of content a much better shot at success.
Understanding Your Audience: Who's Really Engaging With Your Content
A critical piece of mastering Pinterest analytics is looking past simple pin performance and asking a bigger question: who is actually saving your content? It’s easy to create content for a specific "ideal customer," only to find out your real audience is completely different. Your Audience Insights dashboard is where you'll meet the people who genuinely connect with your brand, and the information you find can be eye-opening. This is your opportunity to stop guessing and start making content for the community you truly have.
This dashboard provides a clear picture of your audience's demographics, including their age, gender, location, and the devices they prefer. For instance, you might believe you're targeting millennial women in the US, but your data might show your content is a surprise hit with Gen Z men in the UK. Discovering this isn't a failure; it’s an unexpected opportunity. Instead of fighting the current, you can lean into what's working and tweak your content to better serve this engaged group.
Uncovering Hidden Content Opportunities
The most valuable tool within Audience Insights is the "Interests" and "Affinities" section. This is where Pinterest literally tells you what other topics your audience loves. These interests are ranked by an affinity score, which shows how much more interested your audience is in a topic compared to the average Pinterest user. This data is an absolute goldmine for brainstorming new content you already know will land well.
Let's say you run a blog about minimalist home organization. Your analytics might reveal that your audience has a high affinity for "sustainable living" and "capsule wardrobes." This is a direct signal from your community. They are telling you they're interested in a broader lifestyle of intentional living. With this insight, you could create new content like:
- Pins detailing eco-friendly cleaning hacks.
- Idea Pins on how to build a 10-piece sustainable wardrobe.
- Guides on practical ways to reduce household waste.
This is how you use data to grow your content pillars organically. You shift from what you think your audience wants to what they've clearly shown an interest in. It's a fundamental step in improving your overall Pinterest engagement, as you are now serving content that feels more personal and relevant to them.
Bridging the Gap Between Your Current and Ideal Audience
What if you find a big difference between the audience you have and the one you want to attract? The solution is to make gradual, strategic shifts, not sudden overhauls. Start by finding the common ground. If you want to attract high-income professionals but your current audience is mostly budget-conscious students, look for an overlap. Perhaps both groups are interested in "productivity tips" or "healthy meal prep."
You can begin by creating content that appeals to both, then slowly introduce more topics aimed at your target demographic. Keep a close eye on the performance of these new pins. Are they gaining traction? Are you seeing a small shift in your audience demographics over time? This is a long-term strategy of steering your ship, not turning it on a dime. By checking your audience analytics regularly, you can monitor this evolution and ensure your content strategy is bringing in more of the right people without pushing away the community you've worked hard to build.
Connecting Pinterest to Your Website: Tracking Traffic That Converts
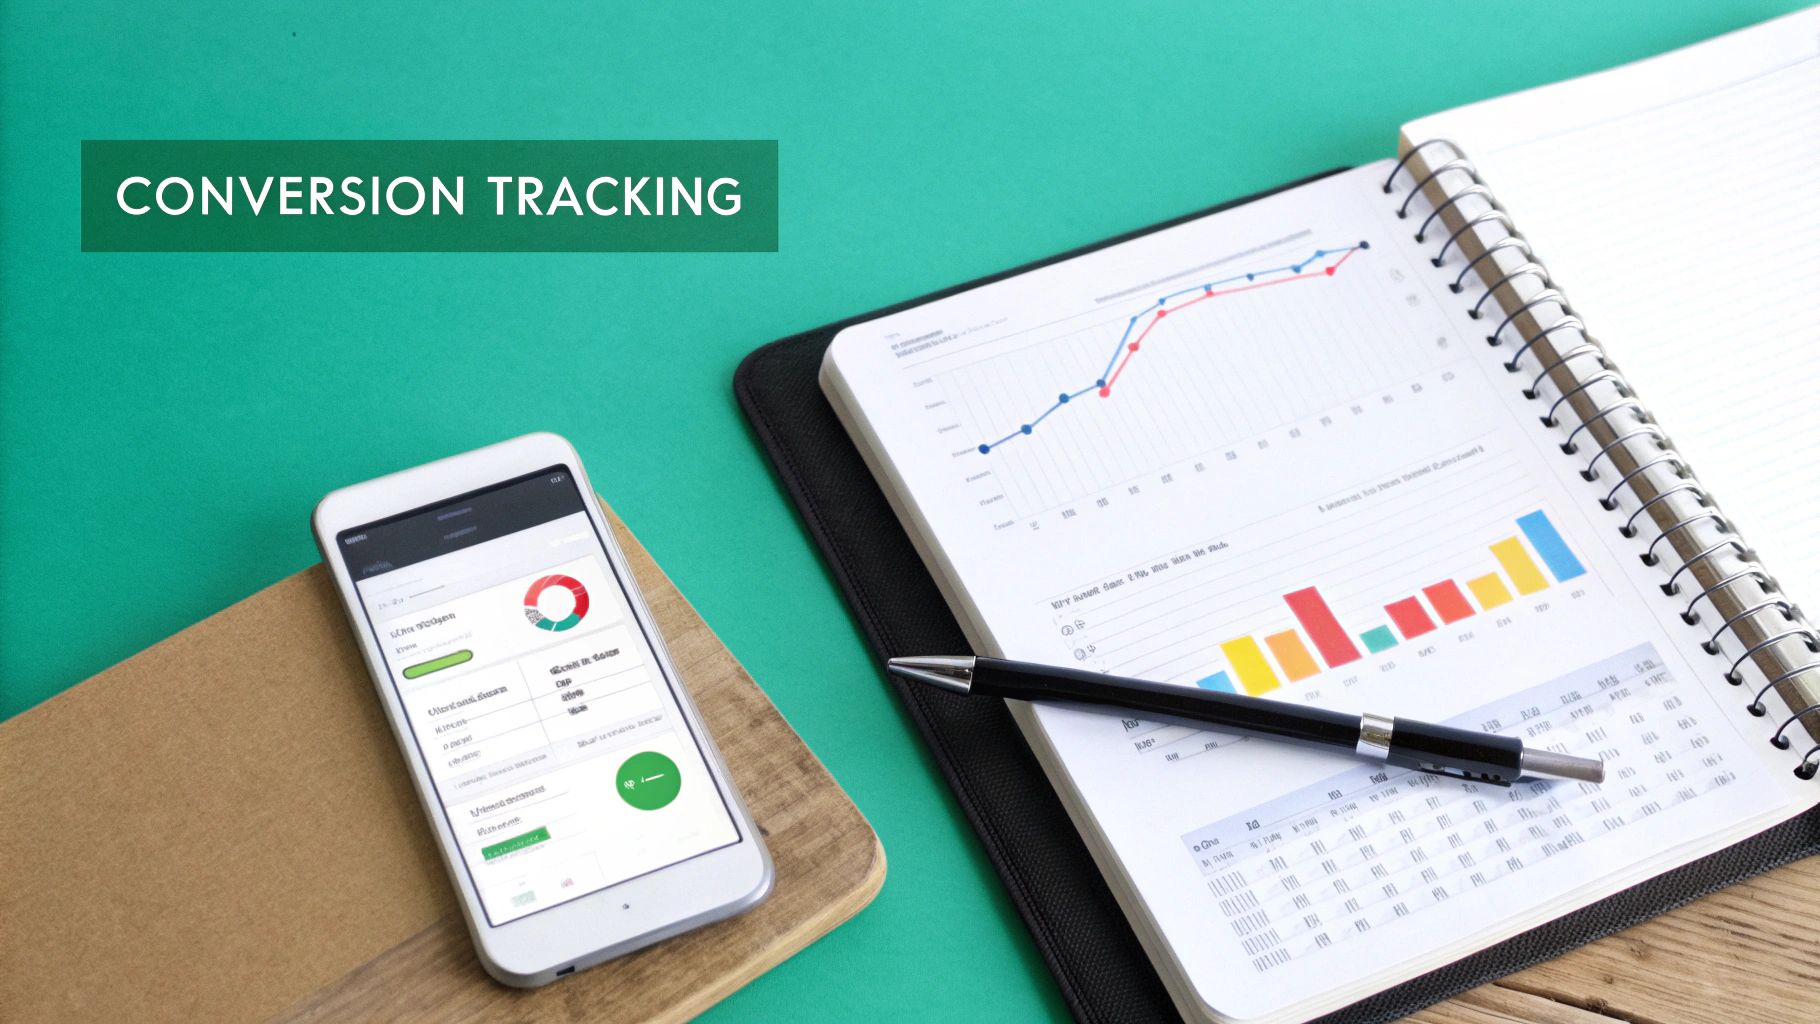
While Pinterest analytics gives you a fantastic look at what’s happening on the platform, its real magic happens when you connect it to your own website. This link is what turns impressions and clicks into a clear story about website traffic, leads, and sales. It helps you figure out which pins attract casual browsers versus those that bring in motivated visitors who actually do something once they arrive on your site.
Seeing the complete journey means looking beyond Pinterest’s native dashboard and using tools like Google Analytics. This lets you follow a user from the moment they discover your pin to the final conversion on your website. Without this connection, you're only getting half the picture, which makes it tough to calculate your actual return on investment (ROI).
Bridging the Gap With Google Analytics
After you've claimed your website on Pinterest, the next essential step is to get comfortable with your website's analytics. Google Analytics is the most popular tool for this, offering a goldmine of information about where your traffic is coming from and what people do once they land on your pages. With proper tracking, you can pinpoint exactly which pins are driving not just clicks, but high-quality traffic—visitors who stick around, check out multiple pages, or buy something.
For instance, you can see how traffic from Pinterest stacks up against traffic from other sources like Google search or Instagram. This view in Google Analytics lets you compare acquisition sources, revealing which platforms deliver the most engaged users.
This data shows you which channels, including Pinterest, are sending the most valuable sessions to your site, helping you decide where to focus your marketing energy.
For anyone using Pinterest to drive traffic and sales to an e-commerce platform, it's also helpful to understand how your efforts fit into a bigger picture. You can find some great strategies to promote your Shopify store that work well with the traffic you're already getting from Pinterest.
Creating a Complete View of Your Pinterest ROI
To really track your ROI, you need to set up goals in Google Analytics. These goals can be anything you find valuable, from a completed purchase to a newsletter signup or a "contact us" form submission. By tracking these conversions, you can attribute them back to their original traffic source.
Let's say you have two pins doing well on Pinterest:
- Pin A drives 1,000 outbound clicks per month.
- Pin B drives 300 outbound clicks per month.
At first glance, Pin A seems like the clear winner. But once you dig into Google Analytics, you discover that visitors from Pin A almost never convert. Meanwhile, visitors from Pin B sign up for your newsletter at a 5% conversion rate. Suddenly, Pin B, despite having fewer clicks, is much more valuable to your business.
This kind of insight is a game-changer. It gives you the confidence to put more time and money into creating content similar to Pin B because you have hard data to back it up. This is how you go from just being active on Pinterest to strategically using it as a powerful engine for your business goals. By connecting the dots between your Pinterest analytics and website data, you can build a content strategy that consistently attracts traffic that converts.
Building Your Future Content Strategy: Using Data To Guide What's Next
After digging into your Pinterest analytics, you’re no longer just guessing what works. You have hard data showing which pins take off and which ones fall flat. Now, it's time to use those insights to create a smart roadmap for your future content. This isn't about throwing spaghetti at the wall; it’s about making deliberate, data-backed decisions that multiply your success.
Your analysis of top-performing pins, audience interests, and even your weaker content creates a powerful blueprint. The goal is to expand on what’s already clicking with your audience while strategically testing new avenues for growth. This means you’re not just remaking your greatest hits, but understanding why they were hits in the first place.
From Data Points to Content Pillars
Your first move is to translate your analytics findings into core content themes or "pillars." Take a look at your best pins, sorted by saves and outbound clicks. What are the common threads? Are they tutorials, inspirational quotes, product roundups, or behind-the-scenes peeks? These repeated successes are your proven content pillars.
For instance, a home decor blogger might see their most saved pins are consistently about "small space organization" and "DIY budget decor." These are no longer just random topics; they are now validated content pillars. The strategy then becomes creating a steady stream of content under these pillars, but with fresh perspectives.
- Small Space Organization Pillar: You could create pins on "Dorm Room Storage Hacks," "Maximizing Closet Space," or "Kitchen Organization for Small Apartments."
- DIY Budget Decor Pillar: This could inspire pins like "Thrift Store Flips," "Seasonal Decor on a Dime," or "Handmade Wall Art Ideas."
This method ensures you’re consistently delivering content you know your audience loves, which is the secret to creating evergreen pins that drive traffic for months, or even years.
Balancing Proven Winners With Smart Experiments
While it’s wise to double down on what works, a content strategy that never changes will eventually go stale. Your analytics can also point you toward smart experiments. Check out the "Interests" section within your Audience Insights. Do you see any surprising categories where your audience shows high affinity? This is your testing ground.
Let's imagine your home decor blog's audience also has a high affinity for "indoor plants." This is a data-driven invitation to experiment. You don't have to overhaul your entire strategy, but you can introduce a few test pins on plant care or "plants that thrive in low light." This is a low-risk way to explore a new content pillar that could attract an even broader segment of your target audience.
The trick is to set a benchmark for these experiments. Measure their performance against your established content. Do they get a similar click-through rate? Are the saves comparable? This organized testing lets you innovate without tossing out the core strategy that’s already working. As you fine-tune your content strategy, looking at various tools can improve your overall marketing efforts. You can explore different marketing software options to see how other platforms might complement your work on Pinterest.
Ultimately, using your Pinterest analytics to build your future strategy is about creating a cycle of constant improvement. You analyze performance, define your core pillars, test new ideas based on audience data, and measure the results. This turns your Pinterest presence from a simple content-sharing platform into a powerful, predictable engine for business growth.
Ready to stop guessing and start growing? Creating and testing all this content can feel like a full-time job. With Pin Generator, you can create dozens of high-quality, unique pins in minutes, not hours. This frees you up to focus on strategy and analysis while our tool handles the creative work. Start generating winning pins today and turn your data into your biggest advantage.


