
Pinterest Analytics: A Practical Guide to Growth
2 October 2026
You've published a steady stream of Pins, and Pinterest is sending some visitors to your site. The problem is that you can't explain why one Pin travels while another disappears, which metric deserves attention, or whether a save matters more than a click. The analytics tab has been sitting there untouched because the numbers feel less like guidance and more like a pile of unlabeled instruments.
Pinterest Analytics becomes much more useful when you stop treating it as a scoreboard. It's a feedback loop. You read a signal, change the upstream creative or keyword decision, publish a controlled variation, and return to the dashboard to see whether the change helped. By the end of this guide, you'll know what to inspect, what each metric can and can't tell you, and how to connect measurement with a repeatable publishing workflow.
Table of Contents
- The Dashboard That Nobody Opened for Six Months
- What Pinterest Analytics Actually Is
- The Metrics That Matter and What They Quietly Tell You
- How to Navigate the Pinterest Analytics Dashboard
- Turning Analytics Into a Content Strategy
- Segmentation, Conversion Tracking, and the Automation Loop
- Common Mistakes and Misconceptions Worth Calling Out
- Putting It All Together and Keeping the Loop Running
The Dashboard That Nobody Opened for Six Months
Maya runs a food blog and has been publishing recipe Pins whenever she has time. Her traffic report shows Pinterest visitors, but the totals don't answer the questions she really has. One Pin has thousands of impressions and barely any visits. Another has fewer impressions but sends readers to a recipe page. A third gets saved repeatedly, yet its traffic arrives slowly.
She opens Pinterest Analytics and sees impressions, engagements, saves, outbound clicks, and a list of top Pins. The first instinct is to find the biggest number. That usually means impressions. It feels reassuring to see a Pin placed in front of many people, but reach alone doesn't explain whether anyone understood the offer, wanted to keep the idea, or visited the linked page.
The word engagement creates another snag. Does it mean a click? A save? Someone opening the Pin to read the title? The answer matters because each action reflects a different kind of interest. A close-up can show that the design earned attention, while an outbound click shows that the Pin persuaded someone to leave Pinterest. A save often signals future intent, but it isn't the same as immediate traffic.
Practical rule: Never ask whether a Pin “performed well” before deciding which action you wanted it to produce.
The dashboard also creates a tempting but misleading story around viral Pins. A Pin can spread because the image is attractive, the topic is timely, or the idea is broadly useful. None of those outcomes guarantees that the Pin will match the landing page or make the next step obvious. High distribution and high commercial value are related, but they're not interchangeable.
The useful reading sequence is simple:
- Read the signal: Identify whether the problem is discovery, attention, consideration, or action.
- Find the upstream cause: Check the title, description, board context, visual hook, format, and landing page.
- Make one deliberate change: Don't redesign every part of the publishing system at once.
- Measure the next cycle: Compare the revised creative with a sensible baseline instead of judging it immediately.
Pinterest Analytics has been part of Pinterest's business toolkit for years. Its help documentation describes reporting for overall performance, performance over time, top boards, and top Pins, with the default reporting window showing the last 30 days in the documented interface (Pinterest's Pinterest Analytics documentation). Pinterest also frames its measurement tools around audience insights and trends, not just individual post totals.
By the final page, you should be able to look at a metric and say what it suggests, what it doesn't prove, and which creative decision should follow. You'll also have a practical way to turn that decision into the next publishing cycle.
What Pinterest Analytics Actually Is
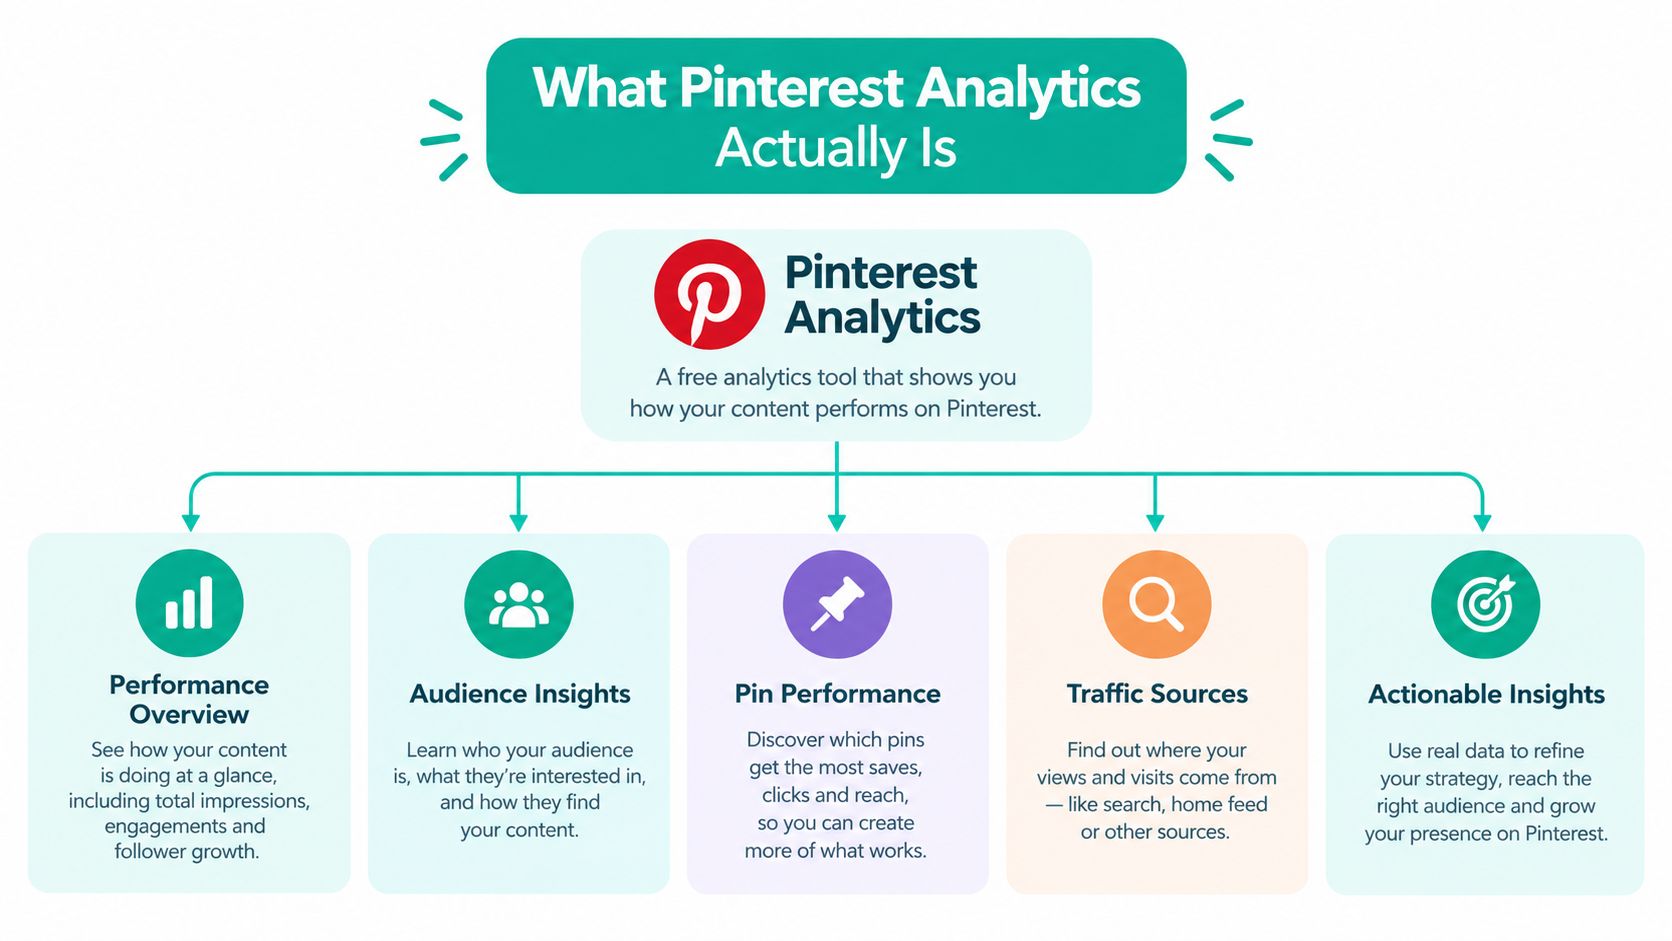
Pinterest Analytics is the native measurement layer for a Pinterest business account. It turns activity around your profile and Pins into signals you can inspect over time. Pinterest describes the tool as a way to understand overall performance, audience-specific insights, and trends, while its measurement resources also cover organic, paid, and earned engagement (Pinterest's business analytics platform).
Think of the dashboard as a restaurant's point-of-sale screen. The screen doesn't cook the meal or decide the menu. It records what customers ordered, which dishes attract attention, and which items lead to a completed purchase. The chef then uses that information to adjust the menu, presentation, and timing. Pinterest Analytics plays the same role for your content. It records what people see and do, then gives you evidence for your next creative decision.
The main reporting areas
The labels and layout can change as Pinterest updates its business tools, but the reporting logic is consistent. Start by matching your question to the type of report you need.
- Overall performance: Use the account-level view to understand reach and engagement across the selected period. Here you ask whether discovery is expanding or contracting.
- Pin performance: Move to individual content to compare designs, topics, titles, boards, and formats. Here you diagnose creative choices.
- Audience insights: Review the audience context available to your account. It can help you see which interests and user groups align with the content people interact with.
- Conversions: Use conversion reporting when your website measurement setup is connected. Here Pinterest activity can be evaluated against actions on your site.
The dashboard isn't a replacement for your website analytics. Pinterest can tell you that people clicked out, saved a Pin, or interacted with a creative. Your website analytics can tell you what happened after the visitor arrived, such as whether they viewed another page, joined a list, or completed a purchase. Those systems answer different questions, so use them together.
Organic reporting and paid reporting
Organic Pinterest Analytics helps you understand content published through your profile and the behavior associated with it. Pinterest Ads reporting serves paid campaigns and includes the context needed to evaluate promoted distribution. A Pin may appear in both environments, so label campaigns carefully and keep your comparison fair.
You'll need a Pinterest business account for the full business measurement experience. Before interpreting any chart, confirm that you're viewing the right account, date range, and content scope. Many apparent performance changes come from comparing different filters rather than from a real change in audience response.
The Metrics That Matter and What They Quietly Tell You
A metric is useful only when you connect it to a question. Impressions answer whether Pinterest displayed the Pin. Saves suggest that someone found the idea worth keeping. Outbound clicks show that the Pin created enough relevance or curiosity to send a person to your website. Treating those actions as interchangeable is the fastest way to make the wrong creative decision.
The table below gives each core metric a practical interpretation. “What good looks like” isn't a universal target. It means the metric is behaving in a way that supports the job you assigned to the Pin.
| Metric | Plain-English Meaning | What Good Looks Like | Common Misinterpretation |
|---|---|---|---|
| Impressions | How often Pinterest displayed the Pin | Visibility is growing among a relevant audience | Assuming reach equals interest |
| Engagements | Interactions with the Pin, including actions such as saves, clicks, and close-ups | People do more than passively scroll past | Treating every interaction as a business result |
| Close-ups | A person opened the Pin for a closer look | The visual hook or topic created curiosity | Assuming curiosity means the person will click |
| Saves | A person kept the Pin for later | The idea has lasting or reference value | Assuming a save creates immediate traffic |
| Outbound clicks | A person left Pinterest for the linked destination | The Pin and landing page form a convincing next step | Ignoring page speed, relevance, or the call to action |
| Conversion activity | A tracked action on the website after Pinterest interaction | The content attracts visitors who take the intended action | Claiming Pinterest caused an action without a sound setup |
Impressions show distribution, not intent
Impressions are a useful first diagnostic. If a Pin receives little exposure, investigate its topic, title, description, board placement, visual clarity, and relationship to current demand. Pinterest's analytics and trend tools are designed to help marketers compare performance over time and understand audience interests, so a single total shouldn't be read in isolation.
High impressions can still hide a weak proposition. A broad image may earn distribution because it fits a popular subject, while the wording fails to explain what the reader gets after the click. Use impressions to ask, “Did Pinterest find opportunities to show this?” Then use the next metric to ask whether people cared.
If the definition of impressions feels slippery, this explanation of impressions on Pinterest offers a useful refresher. Keep the distinction clear: an impression is an opportunity to be noticed, not evidence that the person understood or wanted the content.
Engagements and close-ups reveal the first layer of attention
Engagements combine several behaviors, so the total is best treated as a diagnostic bucket. A high engagement count deserves a closer look at its components. If close-ups are doing most of the work, the Pin may have a strong cover image or headline but weak next-step direction. If saves dominate, the content may be useful for planning or reference even if it isn't designed for immediate visits.
Close-ups are especially helpful when a Pin contains text overlay. They suggest that the viewer paused long enough to inspect the idea. That's a creative signal, not a conversion verdict. Improve the title, visual hierarchy, and promise first, then see whether outbound clicks respond.
Saves and outbound clicks represent different kinds of value
A save is a delayed-intent signal. Someone may be collecting recipes, planning a project, or building a shopping list. A saved Pin can continue working after the original publishing moment, but you shouldn't use saves as a substitute for traffic when the business goal is a site visit.
Outbound clicks are closer to the traffic objective. If impressions and close-ups are healthy but clicks are weak, inspect the promise made by the Pin. Does the title tell the viewer what awaits them? Does the image make the destination feel relevant? Is the call to action visible without overwhelming the design?
Date windows prevent premature conclusions
Pinterest reports can be viewed through different time windows, including short and longer attribution views where available in the account interface. A short window helps you inspect recent response. A longer window gives evergreen content time to accumulate discovery and delayed actions. Use the same window when comparing a baseline with a revised creative, or your conclusion will reflect different exposure periods.
Conversion reporting requires an installed measurement connection, such as the Pinterest Tag or a server-side Conversions API setup. Track the actions that matter to your business, then verify that those actions appear in the conversions report. Reporting may take time to process, so don't treat a freshly published Pin's first reading as a final result.
How to Navigate the Pinterest Analytics Dashboard
Log in to the Pinterest business account that owns the profile you want to review. Open the top navigation, select Analytics, and begin with the account overview rather than jumping straight to a top Pin. The overview gives you the broadest context and helps you notice whether the account's overall direction matches what individual Pins appear to be doing.

Start with the overview
Look for the date selector first. Choose the period that matches the question you're asking. A recent period can reveal a creative change or seasonal shift, while a broader period can make evergreen patterns easier to see. Record the selected dates in your notes before you compare the result with another report.
The overview answers reach questions:
- Is Pinterest showing more or less of the account's content?
- Are interactions moving in the same direction as exposure?
- Are outbound clicks keeping pace with visibility?
- Which boards or content groups appear in the account's leading results?
Use the content type filter when the account publishes more than one format. Mixing standard Pins with video content can make a creative comparison unclear because each format earns attention differently. If the interface offers an export control on the panel, export the view before switching filters so you preserve the exact slice you inspected.
Move into individual Pin statistics
Select the Pin or content performance area, sometimes labeled Pin Stats or Content, depending on the version of the interface. Sort by the metric that matches your goal, not automatically by impressions. A traffic campaign should begin with outbound clicks. A discovery campaign may begin with impressions, then inspect saves and close-ups for quality of attention.
Open the leading Pins and compare the elements they share. Look at the image composition, text overlay, title, description, destination, board, and publication context. You're searching for repeatable patterns, not a single lucky winner. If every top Pin uses a clear problem-led title, that pattern deserves a controlled test across another topic.
Don't assume a filter remains active when you move between tabs. Check the date range, content type, and account scope again each time. A dashboard can appear inconsistent because one tab has returned to its default view.
Creators who publish video or Idea Pins should also inspect the video-specific panel when it appears. Watch behavior and still-image interactions don't answer the same question, so compare like with like.
For a broader view of how different platforms organize reporting, you can also consult Gainsty's free analytics guide. Use it for context, but keep Pinterest's own dashboard as the source of truth for Pinterest-native actions.
The following walkthrough shows how the dashboard can fit into a practical review:
Finish by exporting or recording the three things you'll act on: the strongest content pattern, the clearest weakness, and the next test. A report with no decision attached is just stored observation.
Turning Analytics Into a Content Strategy
Analytics becomes useful at the moment it changes what you publish. Don't build a content strategy from the question, “Which Pin got the most attention?” Ask instead, “Which part of the journey is breaking, and which creative lever can repair it?”
Match the pattern to the likely cause
A Pin with low impressions needs a discovery diagnosis. Review the search language in the title and description, the specificity of the board, and whether the topic aligns with an active audience interest. Pinterest's trend resources are intended to show what content is popular and when people begin searching for keywords, which makes timing useful alongside content analysis (Pinterest Trends).
A Pin with impressions but few saves may be visible without being useful enough to keep. Add a practical payoff, clearer steps, a stronger checklist, or a more specific promise. A Pin with close-ups but few outbound clicks may have earned curiosity while failing to make the destination feel necessary. Strengthen the call to action and align the cover promise with the page people will reach.
| Metric | What It Signals | Creative Lever | Action to Take |
|---|---|---|---|
| Low impressions | Weak discovery or limited relevance | Keyword language, board context, topic focus | Rewrite the title and description, then test a more specific board |
| Low saves | The idea doesn't feel reference-worthy | Utility, structure, completeness | Add steps, a checklist, or a clearer outcome |
| High close-ups, low clicks | The hook attracts inspection but not action | CTA, destination promise, visual hierarchy | Make the next step explicit and match it to the landing page |
| Falling click activity | The creative may feel stale or mismatched | Thumbnail, headline, offer framing | Refresh the visual treatment while preserving the proven topic |
| Strong conversion activity | The Pin and destination support the same intent | Product alignment, landing-page relevance | Create related variants and protect the message that brought the visitor in |
Use funnel stages to choose the metric
At the awareness stage, focus on impressions, close-ups, and the quality of engagement. These signals help you learn whether the topic and visual treatment earn attention from the right people. Don't demand a sale from every discovery Pin.
At the consideration stage, saves and outbound clicks become more informative. A tutorial, comparison, recipe, or buying guide should make its value obvious enough to keep or explore. If people save but don't click, the content may be satisfying the need inside Pinterest. That can be useful for brand discovery, but it also tells you to improve the reason for visiting the site.
At the conversion stage, connect Pinterest activity with website events. A product Pin needs more than attractive design. The destination should load into the same conversation, with the same product, benefit, and expectation. When conversion activity rises alongside relevant outbound clicks, preserve the alignment rather than changing the creative merely to chase a larger reach number.
Turn timing into a publishing rule
Don't use trend information as a reason to publish random content. Use it to create a planning rule. When a relevant topic begins gaining search attention, prepare the visual, metadata, board placement, and destination before demand becomes obvious to everyone in your category. Pinterest's trend reporting is particularly useful for spotting seasonal or regional differences, so review the audience context before assuming a trend applies equally to every market.
Pinterest has a substantial and expanding global audience. Pinterest reported 619 million monthly active users in Q4 2025, up 12% year over year, and 275 million weekly users, while Hootsuite reported 631 million monthly users in 2026 and 11% year-over-year growth (Hootsuite's Pinterest statistics). The practical implication is not that every account will grow at the same rate. It's that old assumptions about who uses Pinterest may leave useful audience segments out of your testing.
Use a simple decision tree:
- If impressions fall, test topic specificity, keywords, board relevance, and timing.
- If close-ups fall, test the cover image, text contrast, and headline hook.
- If saves fall, test practical depth and the usefulness of the promised result.
- If clicks fall, test the CTA, destination match, and thumbnail framing.
- If conversions fall while clicks remain steady, inspect the landing page and tracking before changing the Pin.
Segmentation, Conversion Tracking, and the Automation Loop
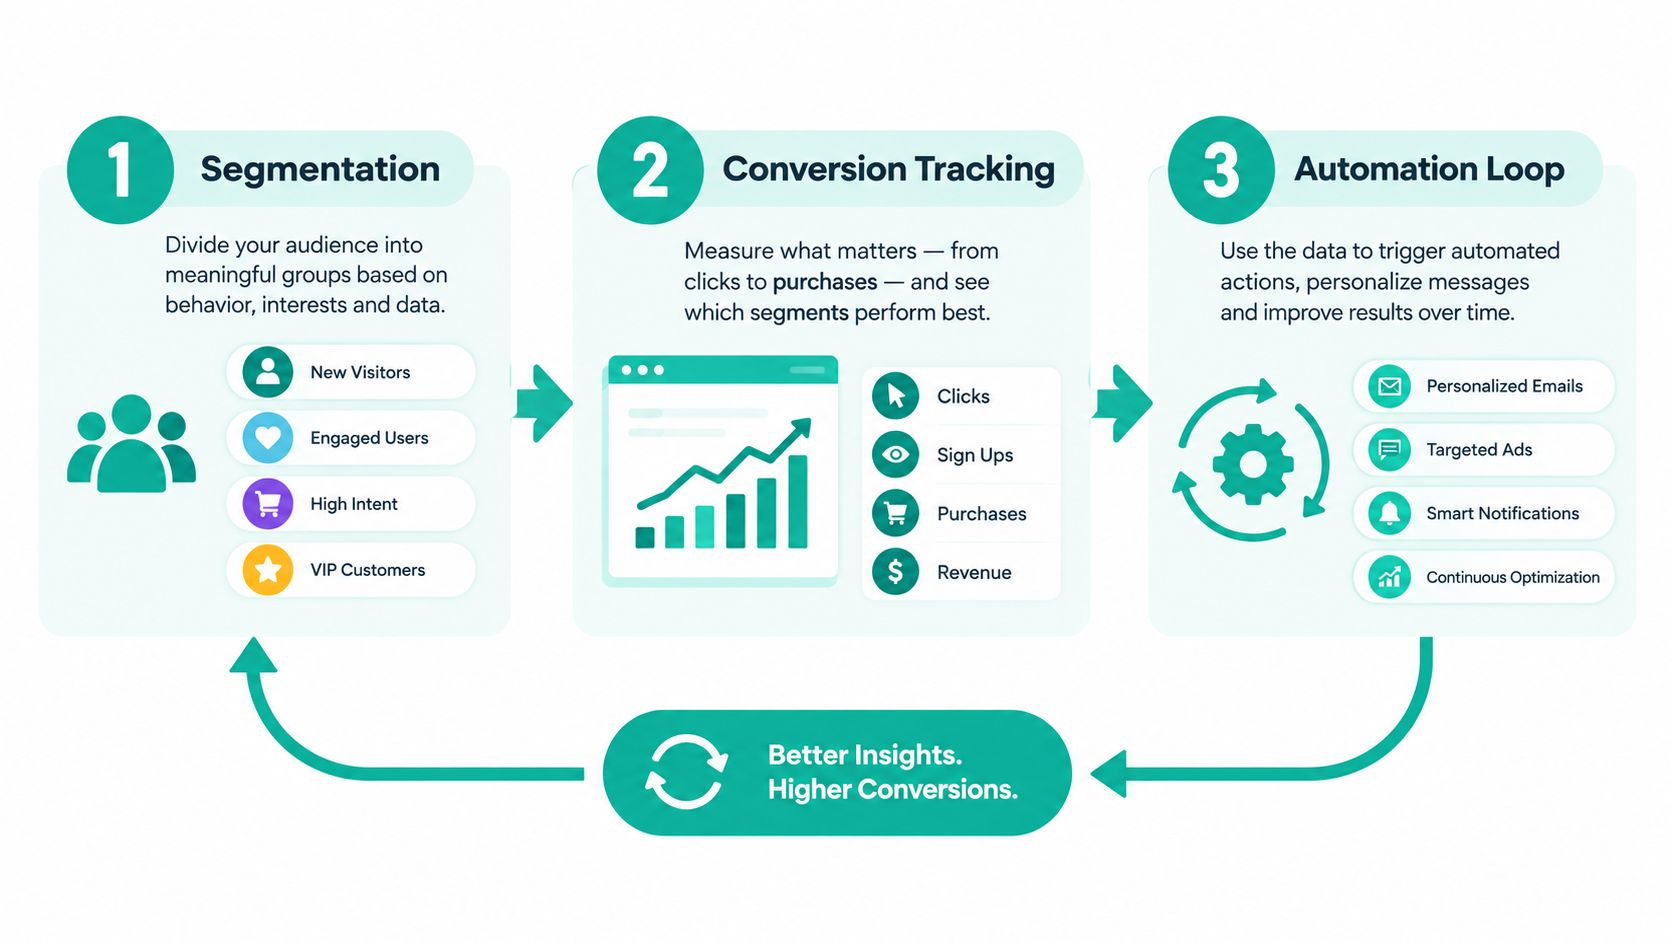
A total account view can hide the segment that matters. Separate performance by board, content type, topic, destination, and date range so you can distinguish a save-friendly collection from a click-friendly one. A board that attracts planning behavior may deserve different creative from a board designed to move product traffic.
Begin with a clean comparison:
- Select one date range.
- Filter to one content type.
- Compare boards or topic groups.
- Sort once by saves and again by outbound clicks.
- Record the creative traits shared by each group.
- Repeat the comparison over a later cycle.
This process gives you two different pattern libraries. The first contains content people want to keep. The second contains content that motivates a visit. They may overlap, but you shouldn't assume they do.
Set up conversion measurement
The Pinterest Tag is a website-based measurement script that helps Pinterest associate site actions with Pinterest interactions. The Conversions API sends comparable event information from your server or connected system. In plain terms, the Tag observes activity in the browser, while the server-side connection can send event data directly from your systems.
Choose events that reflect the business outcome you care about. Depending on the site, that might include a page view, lead submission, add-to-cart action, checkout start, or purchase. Don't install tracking merely to fill a report with events. Define the event, its destination, and the decision it will support.
After installation, use the Conversions report to verify that events arrive with the expected names and destinations. Test the path yourself, check whether duplicate events appear, and confirm that the reported action matches actual site behavior. URL parameters remain useful for comparing traffic in your website analytics, but they don't replace platform conversion measurement.
Feed the learning back into production
Once you've identified a strong pattern, turn it into a creative brief rather than copying one Pin indefinitely. Keep the topic or promise stable, then vary one element such as the opening image, typography, title framing, or call to action. Publish the variants through the same relevant boards and use a consistent review window.
Pin Generator can generate on-brand Pin designs, titles, descriptions, and alt text, select boards, and schedule recurring publishing from sources such as product catalogs, RSS feeds, and connected stores. If you want to compare automation options and workflows, this guide to Pinterest analytics tools is a relevant starting point.
A healthy loop has four properties:
- A defined baseline: You know which existing content or period you're comparing against.
- A controlled change: The test has a clear creative or metadata difference.
- A stable measurement view: You keep the account, content type, and date range consistent.
- A documented decision: You record what changed, what happened, and what you'll test next.
Avoid promising yourself a fixed uplift before the test begins. The verified outcome may be a stronger save pattern, a clearer click path, a discovery improvement, or evidence that the original hypothesis was wrong. The purpose of automation isn't to publish more noise. It's to make the cycle of learning and production easier to repeat.
Common Mistakes and Misconceptions Worth Calling Out
The vanity-metric trap starts with a large impression total. A creator sees a dramatic reach number, celebrates the apparent success, and then notices that site traffic hasn't changed. The problem isn't that impressions are useless. The problem is that impressions answer only whether Pinterest displayed the content.
Follower count can mislead in the same way. Pinterest discovery isn't limited to people who already follow your profile, so a smaller following doesn't automatically mean weak distribution. A top-Pin ranking also needs context. One Pin may lead because it had more time to circulate, matched a seasonal subject, or benefited from a different audience intent.
| Common Mistake | Why It Misleads | Faster Fix |
|---|---|---|
| Celebrating reach alone | Visibility doesn't show whether people acted | Pair impressions with close-ups, saves, and outbound clicks |
| Comparing unrelated formats | Different formats invite different behaviors | Compare similar content types and goals |
| Reacting to one spike | A single Pin can distort the account picture | Review repeated patterns across comparable periods |
| Treating same-day results as final | Reporting and attribution need processing time | Wait for the dashboard to settle before making a major change |
| Assuming every click is direct Pinterest demand | Sharing and tracking changes can affect attribution | Use platform reporting and tagged URLs together |
| Ignoring small-sample context | A small amount of content can make averages unstable | Inspect individual Pins and avoid broad conclusions |
| Changing five elements at once | You won't know what caused the result | Test one meaningful variable at a time |
Pinterest Analytics isn't a real-time trading screen. The interface processes activity, and fresh numbers can change as reporting catches up. That makes same-day decisions risky, particularly when a Pin has only just been published or a tracking setup has recently changed.
Attribution deserves its own audit. A visitor may discover a Pin, copy the URL, and share it through email. A tagged URL can also lose parameters when it passes through another tool or redirect. Platform conversion windows may assign value differently from your website analytics. These differences don't mean one report is automatically wrong. They mean you need to define what each system is measuring before comparing totals.
A dashboard is a hypothesis engine, not a scoreboard.
For smaller accounts, averages can also be fragile. One unusually successful Pin can make a short reporting period look like a new normal. Use repeated comparisons, inspect the underlying Pins, and write down the conditions surrounding a spike. If the topic, format, and audience context don't repeat, treat the result as a clue rather than a strategy.
The faster fix is disciplined review. Compare impressions with action, use rolling context instead of isolated snapshots, audit URL parameters regularly, and keep the Pinterest Tag alongside your website tracking. Above all, let the dashboard change a decision. If the numbers never affect your titles, designs, boards, timing, or destinations, you're collecting reports rather than learning.
Putting It All Together and Keeping the Loop Running
A food blogger notices that a recipe Pin is getting more close-ups while outbound clicks stay flat. The cover image creates enough curiosity for people to inspect it, but the next step isn't convincing. Her working hypothesis is that the thumbnail promises a recipe without making the benefit or destination clear.
She changes the cover treatment for the next batch, making the result more explicit and aligning the title with the linked recipe page. She keeps the topic and board context stable so the comparison remains useful. Then she creates variants from the revised template, publishes them on the planned schedule, and returns to Pinterest Analytics after the measurement window has matured.
The important result isn't a guaranteed percentage lift. It's the sequence: close-ups identified the attention problem, the creative change addressed the upstream cause, and outbound clicks provided the verification signal. If clicks improve, she has a stronger pattern to develop. If they don't, she can test the destination, CTA, or title without guessing from scratch.
Keep this checklist visible:
- Review consistently: Open the dashboard on a fixed weekly schedule.
- Choose one metric: Pick the signal connected to the current business goal.
- Change one lever: Adjust the design, copy, board, topic, timing, or destination.
- Allow a fair comparison: Use a consistent review window and comparable content.
- Document the result: Record the hypothesis, change, outcome, and next test.
Pinterest growth rarely comes from one frantic dashboard session after a disappointing month. It comes from a steady rhythm of reading, adjusting, publishing, and checking again. When you keep the loop running, each review gives the next batch of Pins a clearer job.
Pin Generator helps you turn those decisions into production by generating on-brand Pin designs, titles, descriptions, and alt text, then organizing board selection and recurring publishing from feeds, catalogs, and connected stores. If you want to connect Pinterest Analytics insights with a repeatable content workflow, visit Pin Generator and explore the available templates, scheduling, and publishing tools.